Martket Update for February 28, 2014

We’ve been keeping a close eye on China this week after recent speculation of property price cuts and banks halting lending to the property sector. This came along with the devaluation in the Chinese yuan, which continued into this week. Heading into Friday, it looked as though the trend is losing steam. The Chinese stock market rallied on Friday, but this came after a sell-off early and a plunge in the yuan.  The yuan fell as low as 6.18 to the U.S. dollar today, down from 6.04 at the end of January.

The drop in the yuan would not be new worthy if it were any other currency. In this case, the government tightly controls its value and has guided it upwards for several years. This is partially done for political reasons, such as quieting politicians in the U.S. who would like to put tariffs on Chinese imports. It is also done for confidence reasons. There were times when traders tried pushing the yuan lower, but the central bank reacted by raising its value and forcing it higher.  The yuan is only allowed to fluctuate 1 percent each day from the fixed price though there are also rumors indicating the trading band will widen to 2 percent.

Over the past few years, Chinese officials been adamant the yuan is fairly valued. The reality is if China had a floating currency, it would have weakened in 2013 along with other emerging market currencies, instead of rising to a multi-year high versus the U.S. dollar.

So why is the world concerned about a small drop in the Chinese currency? The answer lies in China’s size and investor assumptions. Taking the latter first, there are likely hundreds of billions of dollars bet on Chinese currency appreciation. Businesses and financial institutions alike expect a stronger yuan. When everyone is on one side of the trade, a small change in value in the wrong direction can lead to huge and widespread losses.

More importantly, the value of the yuan greatly affects emerging markets that compete with China. One big reason why there wasn’t an emerging market currency crisis in 2013, even though there were some big losses in the Indian rupee and Indonesian rupiah, was because the Chinese yuan was stable. If the yuan begins to depreciate, this will put pressure on other emerging markets.

On the bright side, odds are the selling is close to finished, assuming the Chinese central bank is behind the move (the popular opinion at the moment). That portends a relief rally next week as Chinese investors breathe a sigh of relief. With U.S. economic data solid and more indexes pushing to new all-time highs this week, it will be a good one for the bulls. If the yuan selling isn’t over, no amount of good economic data will be able to stop the financial market volatility that erupts.

ETF Investor Guide: February 2014

ETF Investor Guide February 2014

A Note from Matt:

We would like to introduce you to the first issue of The ETF Investor Guide. For the past several years it has been my privilege, along with our editors and analysts, to provide you with comprehensive coverage of hundreds of ETFs. The ETF Investor Guide team is very excited to present you with our enhanced newsletter and we are confident it will help you make sound investment decisions for years to come. As you will notice, we have included some new data, such as the yield and expense ratio for each ETF. We will continue to provide numerous model portfolios you can use to allocate your investments, based on your individual goals and risk tolerances. Thank you for your continued loyalty; should you ever have any questions or comments about our newsletters, please call me directly at (888) 252- 5372. It would be my pleasure to personally discuss our buy, hold, and sell recommendations, as well as our thoughts on the market at any time.

Market Perspective:

TStocks have started to climb their way back to positive territory in February. Although the NASDAQ performed well over the first month of the year, the S&P 500 Index, Dow Jones Industrial Average and Russell 2000 Index all started the year on a downswing. These indices all stopped their slide early in February though and are within striking distance of break even for the year. From a technical viewpoint, the indices must break into positive territory and then go on to set new all-time highs before the correction can be said to be over. That gives the bears some breathing room, but beyond very short-term indicators, the bulls still have the long and intermediate term trends in their favor. We fully expected a correction after the strong close to 2013 and results over the first 46 days of the New Year were in line with this prediction.

Please Click Here to continue reading the ETF Investor Guide for February 2014.

Market Update for February 27, 2014

The Russell 2000 broke out to a new all-time high yesterday, a positive for the bulls as small-caps tend to lead during bull markets. It will be interesting to see over the next few days if other indexes keep pace. While the NASDAQ has done well this year and the S&P 500 Index is right near its all-time highs, the Dow Jones Industrial Average and the Dow Transports are still below their highs. The Dow Industrials needs a 2.5 percent rally to reach new high this year, while Transports need about a 4.5 percent rally.

On Monday, we mentioned that investors shrugged off bad data in the home building sector and that’s usually a sign of underlying strength. Yesterday, we saw that strength validated with upside surprise in new home sales, which sent the home builders sharply higher.

The Chinese markets stabilized over the past few days and the yuan stopped its brief devaluation for the time being. There was a moment of panic in China with their currency sliding, and the news of one bank halting loans to the real estate sector has the highest level of government asking questions. Although the yuan only fell a bit over 1 percent in the past month, it is the biggest decline in years for the currency.

Furthermore, until there is official confirmation or denial, the widespread belief is the central bank of China was responsible for the devaluation of the yuan. Prior devaluations in the past few years were the act of market participants, not the central bank, which is why the move drew so much attention. If China has decided to let the yuan weaken, there are billions of dollars, yen, yuan and euros positioned on the wrong side of this move.

With the National People’s Congress coming up next week, there is the chance that reforms or policy steps will be announced. Until those meetings end, investors are less likely to take bold positions, either bullish or bearish. The past three quarter end periods have seen cash crunches in the banking system though, and given current events, March 2014 is shaping up to be worse than the prior three quarters. If there are no policy moves, early spring could prove rocky for investors.

The commodity sector gapped higher last week and will likely fall in the coming days. The rallies in oil and gold appear to have run out of steam for now. Copper continues to weigh on the sector, a powerful counterweight to the rally. Until copper turns higher (something most likely dependent on China), the rally in commodities is in doubt, although gold could trend differently due to its monetary characteristics.

Where is the Healthcare Sector Headed?

Healthcare stocks had an excellent run in 2013 and they could be in for another solid advance in 2014. There has been widespread speculation the Affordable Care Act would damage the healthcare sector, for now, the law hasn’t had the negative impact many expected. While there is still a fair amount of uncertainty surrounding the law, thus far the industry has proved resilient and investments in the healthcare sector have generally performed well.

Healthcare providers, expected to take a big hit under the law, have thrived. In 2013, pharmaceuticals and biotechnology have seen their best performance in years. Medical devices had been expected to lag due to the increased taxes imposed by the ACA; instead they have also performed well, with Fidelity Select Medical Equipment and Systems (FSMEX) returning 41.30 percent last year. Overall, most every subsector in the healthcare space has been a good investment and in the year when the ACA began taking effect, the returns were their best since its passage.

When legislation substantially impacts such a large portion of our economy, politics will continue to play a substantial role, with our elected officials having the ability to alter the law on an ongoing basis. This being the case, it is more challenging for investors to find clarity. With 2014 being a midterm election year, Republicans are likely to push for changes, including the modification of the insurer bailout, which safeguards those companies from losing money under the ACA. They certainly will use the law against red state Democrats who face uphill reelection battles.

While Republicans will continue to be vocal in their disapproval, the likelihood of repealing the law or making significant changes is remote. Republicans may win the Senate, but they will not have a veto proof majority. Democrats are deeply invested in the success of the law; if issues arise over the next several years, they will likely use executive or regulatory action to mitigate the impact of any issues. Over the short-term, the greatest challenge is ensuring there are enough people enrolling (especially young people) to make the law viable. The March enrollment deadline is looming and if numbers don’t meet expectations, it could prove to be damaging politically.

We have been a long-time proponent of investing in the historically defensive healthcare sector. With an increasing number of people aging and requiring medical services, there is strong demand which should last for years to come. Plus, the ACA’s goal is to increase the number of individuals purchasing health insurance. The net effect of the law then is to increase spending and demand, which is good for the healthcare industry because it drives up prices and ultimately profits. Even with all of the political bloviating, the industry is not likely to die anytime soon.

There are numerous ways to invest in healthcare with mutual funds, a few of which we will discuss below.

Broad Base Funds

For investors wanting diversification, Fidelity Select Healthcare (FSPHX), Vanguard Health Care (VGHCX), Janus Global Life Sciences and ICON Healthcare (ICHCX) all offer broad based funds that cover the entire sector. ICON and Vanguard both delivered similar 40 percent plus returns in 2013. Both funds maintained a heavy weighting in pharmaceuticals: nearly 50 percent in the case of Vanguard and over 50 percent for ICON.

The Fidelity and Janus funds outperformed ICON and Vanguard by more than 10 percent. In Fidelity’s case, the difference came down to over-weighting of the biotechnology sector, which had an excellent year. Janus was more balanced, with less than 40 percent in biotechnology and 31 percent in pharmaceuticalsFor investors wanting diversification, these broader funds can provide an easy and often best option. If you are a bit more aggressive, the biotech heavy funds have greater upside opportunity, but greater risk. ICON and Vanguard are a bit more defensive and should provide some downside protection relative to their peers.

Biotechnology

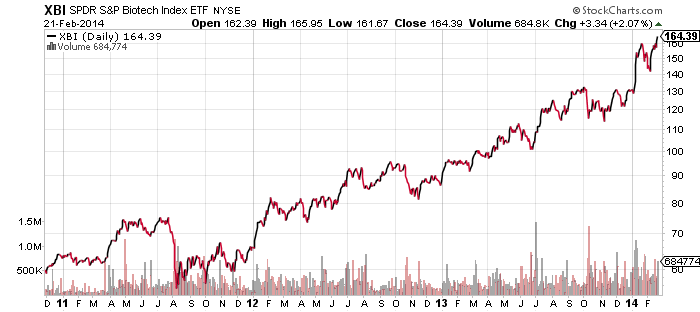
As for the red hot biotechnology sector, among the offerings are, Fidelity Select Biotechnology (FBIOX) and Rydex Biotechnology (RYOIX). Fidelity was the big winner in 2013 as FBIOX climbed more than 60 percent, while RYOIX was up 56 percent. The biggest difference between the funds is their market cap exposure. FBIOX’s average market cap is $12 billion, about 50 percent greater than RYOIX’s $8 billion, due to a 40 percent exposure to mega cap stocks. The Rydex fund has only 25 percent in mega caps, with a heavier leaning towards midcaps at 32 percent of assets.

On valuation measures, Fidelity’s portfolio is aimed at growth companies with higher valuations, but with faster growth prospects. The performance gap makes sense given these fundamentals, but investors looking to be conservative aren’t getting a value portfolio from Rydex. This is still an aggressive growth sector and if you’re bullish enough to want to stay in biotechnology, then sticking with FBIOX makes sense. Ultimately, biotechnology has been a market leader for two years; conservative investors may want to take some profits and look towards more defensive alternatives.

Pharmaceuticals

Fidelity Select Pharmaceuticals (FPHAX) turned in a 41 percent return in 2013. Pharma had been a laggard for years going back to the 2000 bubble, with prices for many stocks bottoming in 2008, so some amount of catch-up is warranted. The big worry in recent years was the expiring of patents on blockbuster drugs and investors succumbed to fear and priced in poor performance; when the companies performed better than expected, valuations increased.

The move in pharma also bucked the trend of rising yields hurting dividend paying shares as investors didn’t lose interest in the relatively high yielding sector. Between pharma and bitoech, the former has the better odds of extending its streak for another year. We continue to maintain a position in FPHAX as we believe it still has upside potential.

Medical Delivery

Fidelity Select Medical Delivery (FSHCX) returned just over 35 percent in 2013. While this sector will be heavily impacted by the ACA, over the long-term these companies should benefit from an increase in demand for services from millions of additional people having coverage. With Medicaid expansion in many states, this coverage should reduce bad debt for hospitals (those people that do not pay for services) as they will likely now have access. For now, the greatest risk facing providers are the reimbursement payments they will receive and the number of enrollees that are reported.

While FSHCX only has 47 holdings, approximately 60 percent of the assets in the fund are allocated to large and mega cap stocks. By and large, those stocks are well positioned to capitalize on industry changes. Over the short-term, the fund may be a bit volatile but we continue to believe it has the opportunity to outperform over the long-term.

Medical Equiptment

Finally, there’s Fidelity Select Medical Equipment & Systems (FSMEX). Even though the fund was up last year, the ACA tax on medical devices may take a toll on the sector. This sales tax is reducing profits by roughly 25 percent, which is worrisome. With the repeal of the ACA unlikely, this sector could face some headwinds moving forward. Sentiment is negative on the sector and performance may be driven by political forces rather than business fundamentals. This makes us uncomfortable as the moves in these stocks may be rationally based, increasing volatility and risk.

For most investors, having diversified healthcare exposure makes the most sense. For more aggressive investors, placing small bets in individual sectors such as pharmaceuticals and medical delivery can provide some additional upside opportunities.

ETF Watchlist For February 25, 2014

db X-Trackers Harvest CSI 300 China A-Shares (ASHR)

China is the market to watch this week and likely for the next few months. The Chinese economy is again reaching a turning point as the leadership tries to deflate the credit bubble without popping it. Real estate prices started falling in one city, resulting in a mini-panic by the Chinese press. The nation is clearly on edge, with shadow banking trust defaults a looming concern adding to fears of a real estate slowdown. On the positive side, when real estate developers slashed their prices in the city of Hangzhou, inventory sold out and they had to turn away customers offering to pay 100 percent cash. The issue is whether there are enough buyers to halt a slide in prices.

This 10 year chart of the Chinese mainland stock market shows a big reason why emerging markets have trailed developed markets over the past three years. The area around the 2000 level is a strong area of support for the market, with the Shanghai Composite making a triple bottom. On the other hand, the fundamentals remain weak. A test of the support level may come in the near future given the volatility we’ve seen recently.

ssec

Guggenheim China Small Cap (HAO)

Not all China ETFs have done as poorly as the A-shares. As this chart of HAO shows, small caps, with their weighting tilted towards consumer companies have held up much better. HAO is actually closer to a breakout than a breakdown, though it has been in a trading range since 2009. This does mean there is more downside risk if China slides though. A loss of 30 percent would only move HAO to the lower end of its trading range and not even represent a significant breakdown for the ETF.

hao

Guggenheim China Real Estate (TAO)

As for real estate in China, it broke out in early 2013, as did the mainland stock market.  The gain though, was quickly lost. TAO is back at the high end of its post-2009 trading range as well. Like HAO, it is closer to its highs than its lows and losses of about 30 percent are possible if sentiment turns bearish on China.

tao

iShares Russell 2000 Index (IWM)

Last week we were looking for IWM to close a gap on the chart and see how it performed as it approached important trendlines. IWM did close the gap and moved higher for the week. As this chart comparing IWM and SPDR S&P 500 (SPY) shows, the small caps continue to outperform the broader market. Even though the S&P 500 Index was flat last week, the strength in small caps is a bullish sign. That said, the small caps still need to push higher before they’re seen as making a bullish breakout. It wouldn’t take much of a drop to put them back below the long-term trendline that stretches back to March 2000.

iwmspy

SPDR S&P Biotechnology (XBI)

At some point, biotechnology stocks are going to take a breather, but when is unknown. As this chart of XBI shows, shares have not only reached new highs recently, but biotechnology stocks still have momentum behind them. This sector has enjoyed as large a run similar to junior gold mining shares. However, unlike mining shares that fell consistently for more than 2 years, biotechnology has been a top performing sector over the same period. We would not be adding shares at these levels and you may want to consider paring back some if a position has grown into a large portfolio holding.

xbi

Market Vectors Junior Gold Miners (GDXJ)

A quick note on the gold mining shares: Shares hit a new high for the year last week but the move is running out of steam in the short-run. A pull back over the coming week or two would not be surprising, with a move as low as $36 possible.  The 200-day moving average on GDXJ is $39.33 and the 50-day MA is $34.73, but rising quickly. Unless shares sell-off beyond the $36 level, a bullish cross is likely in the next month. Except for a brief blip in 2013, GDXJ’s 50-day MA has not traded above its 200-day MA since July 2011.

gdxj

 PowerShares DB Agriculture (DBA)

Agricultural commodities have enjoyed a breakout this year. Whether it can hold up may be decided by China. A stronger global economy can support higher commodity prices, but if the global economy weakens, the general move higher in prices may be snuffed out before it finds its legs. Here investors are looking towards copper for a signal; it remains weak, but is typically the leading indicator for commodities. If copper picks up, the move in agricultural commodities may have legs. Otherwise, these gains may soon be lost.

DBA