SPDR S&P 500 (SPY)
SPDR DJIA (DIA)
PowerShares QQQ (QQQ)
SPDR S&P MidCap 400 (MDY)
iShares Russell 2000 (IWM)
SPDR S&P Dividend (SDY)
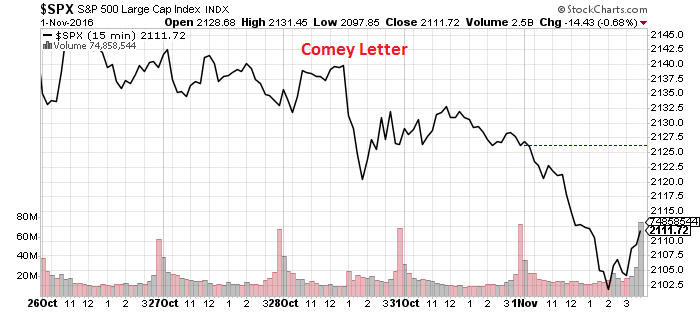
Speculators continue to pounce on political uncertainty to make quick short-term profits in the last few trading days before the election. Investors, however, should remain wary of these markets. Evidenced by this year’s Brexit, political market reactions can reverse swiftly.
The 15-minute S&P 500 Index chart below illustrates the impact of last week’s FBI statements regarding the Clinton email case.
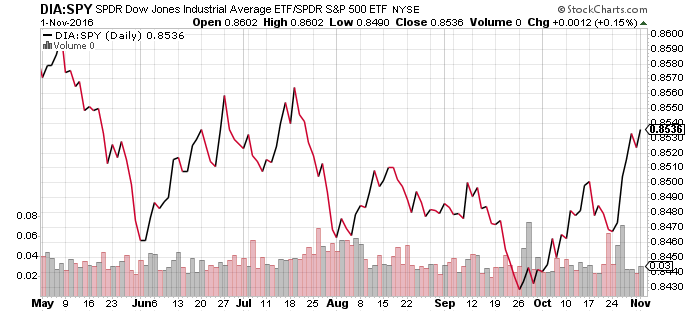
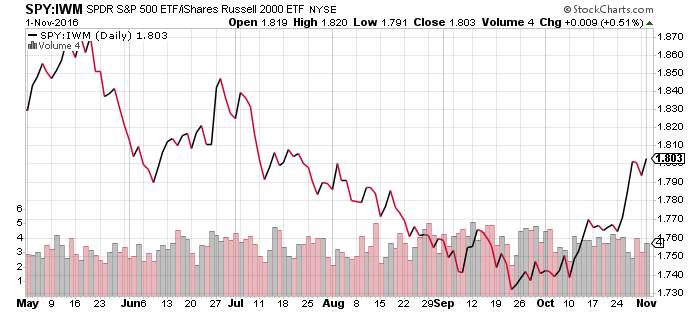
The following price ratio charts reflect the outperformance of mega- and large-caps in the current market. SPY has bested IWM over the past week and DIA has outperformed both.
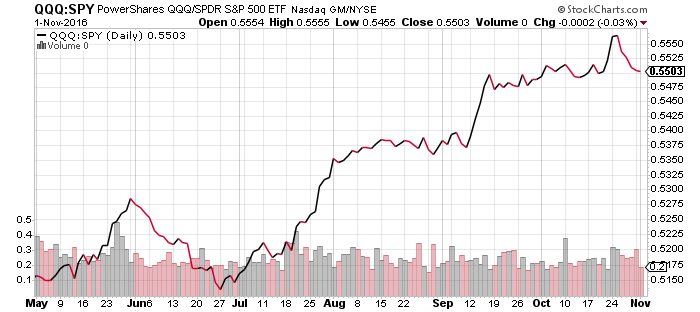
Technology is holding its own, as illustrated in the price ratio comparison of QQQ to SPY.
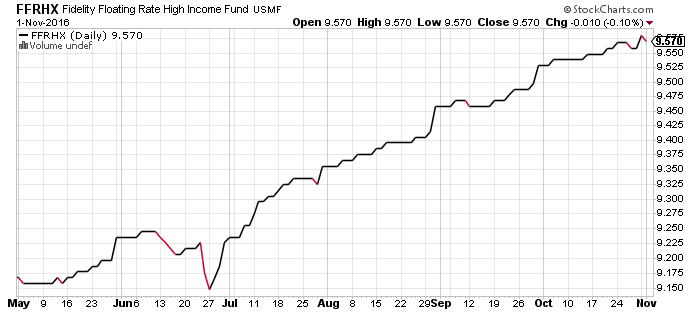
Fidelity Floating Rate High Income (FFRHX)
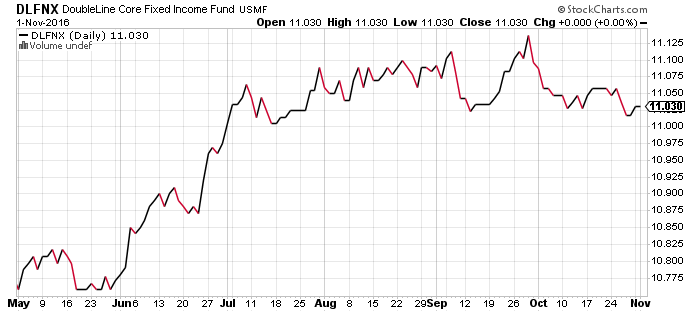
DoubleLine Core Fixed Income (DLFNX)
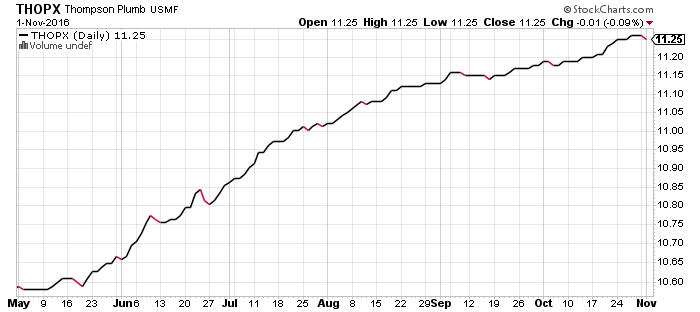
Thompson Bond (THOPX)
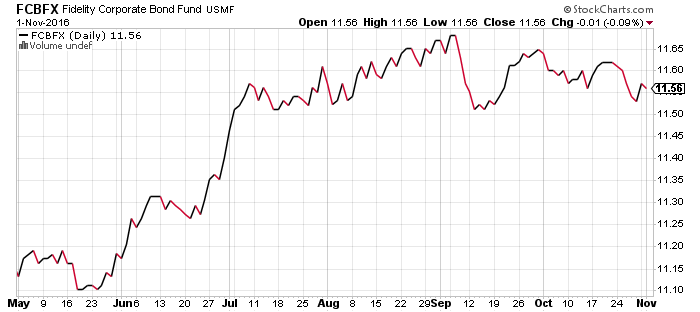
Fidelity Corporate Bond (FCBFX)
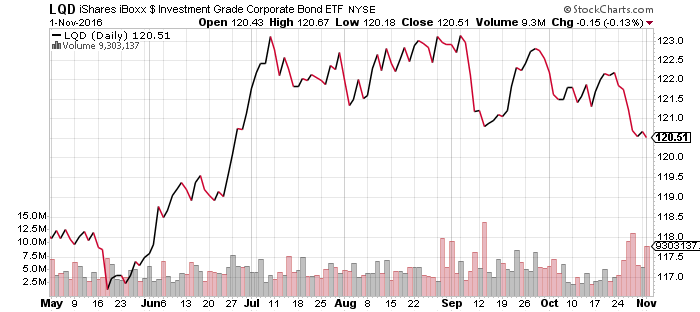
The bond market could rally following the election, as it did on Tuesday, if speculators expect a selloff to delay interest rate hikes.
The Federal Reserve is likely to hike rates in December regardless of the election outcome considering consistently strong economic data.
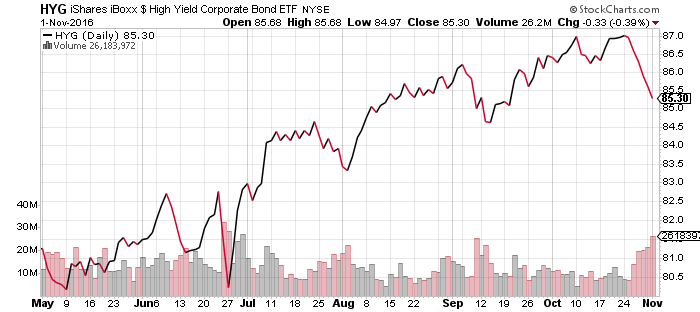
High-yield bonds, conversely, are trending similarly to the stock market.
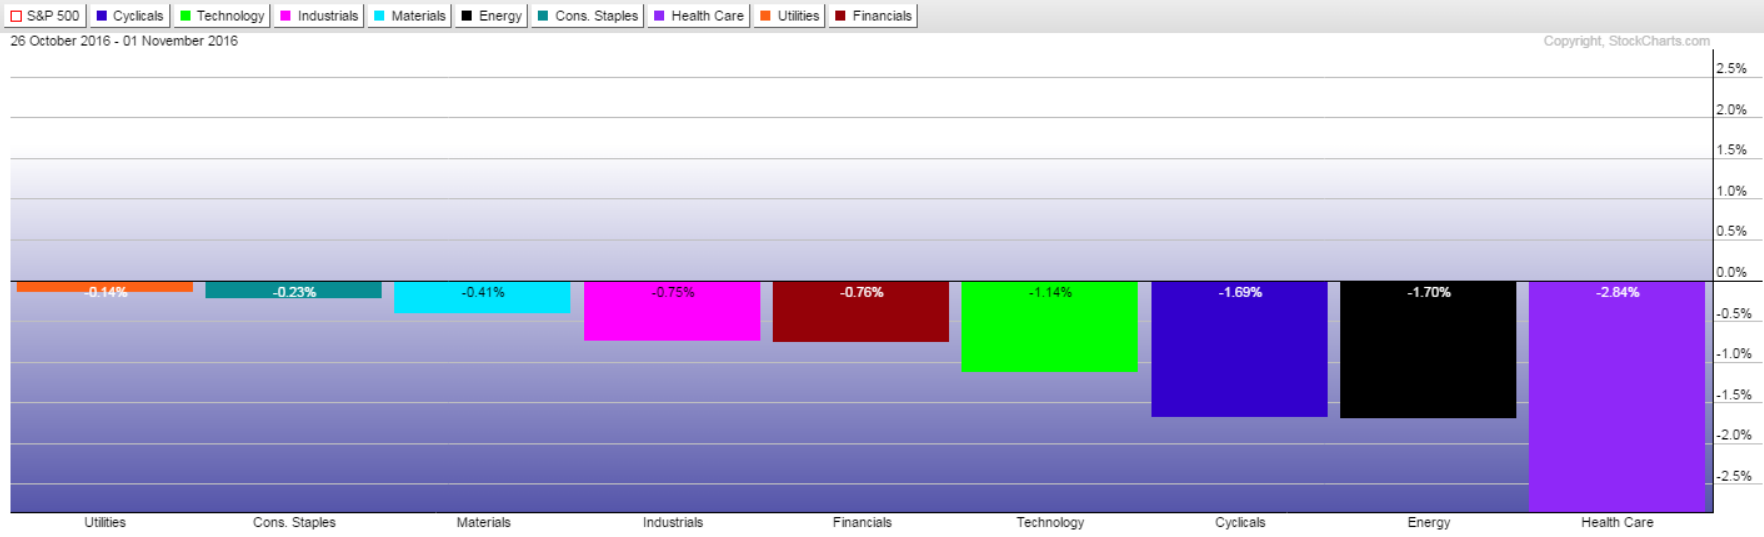
Sector Performance
Utilities and consumer staples held up well over the past week as investors stuck with defensive sectors, while biotech weighed on Healthcare.
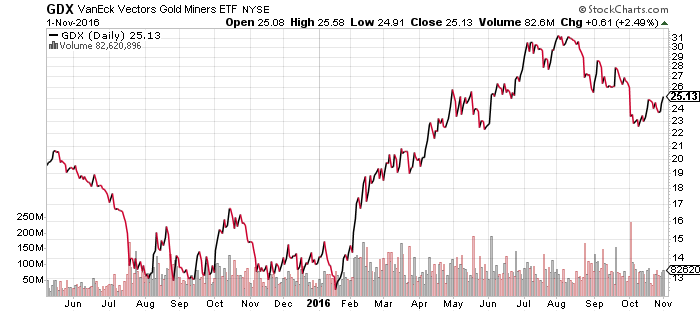
Gold and gold miners are benefiting from increased volatility in the market, but this looks like a bear market rally amid a larger correction for precious metals. This rally is likely to abort, regardless of election outcomes, though it may gain a few more percentage points before downside action resumes. The downside target for GDX is around $20 per share.
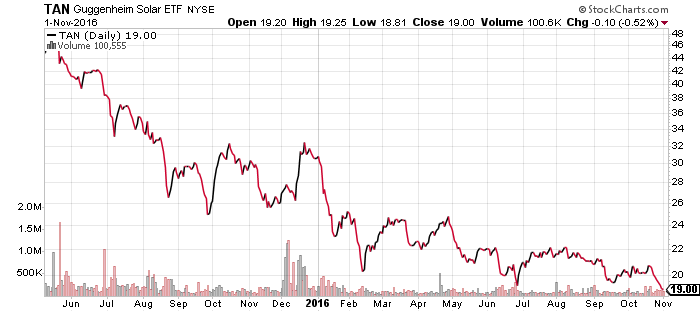
Shares of TAN are down from a high near $50 per share in early 2015 as both energy and interest rates fell. The latest dip is a blip on the long-term chart.
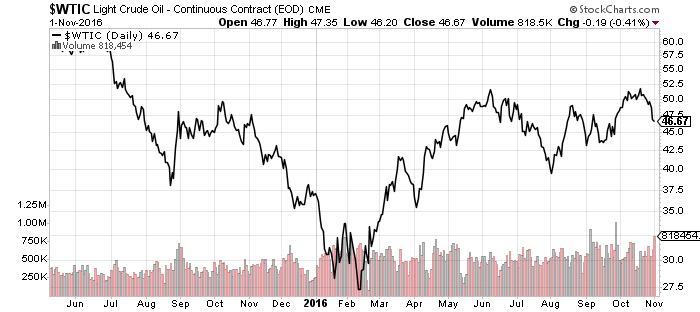
SPDR Energy (XLE)
Over the past week, higher- than-expected inventory and OPEC infighting sent oil prices down to $46. West Texas Intermediate Crude made a short-term peak around $50 a barrel in October 2015 before falling. In June 2016, it peaked near $52 a barrel before sliding just below $40 a barrel. Now in October 2016, it again peaked near $52 a barrel. A repeat of the summer swoon in oil still leaves more than 10 percent potential downside.
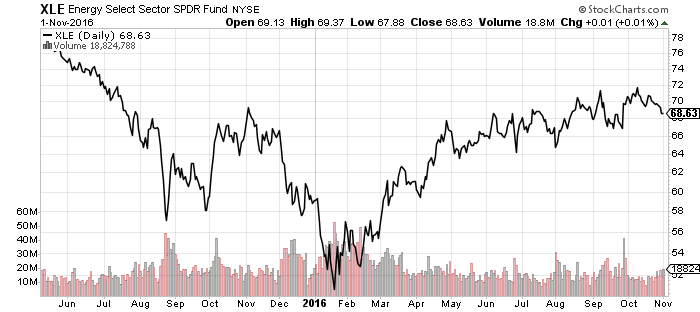
XLE remains in an uptrend that stretches back to January 2016 nonetheless.