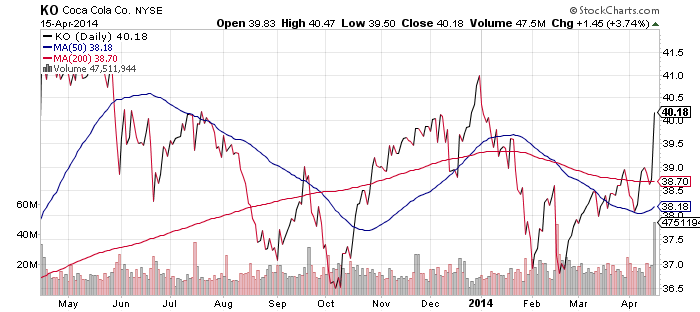
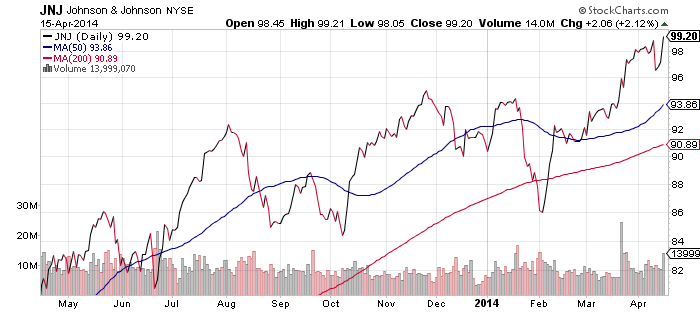
Thus far, earnings season has been solid and companies have been rewarded for good reports. Coca-Cola (KO) and Johnson & Johnson (JNJ) are two examples from this week. Also, Yahoo (YHOO) reported after the bell. It beat earnings estimates by a penny per share and the stock was up more than 6 percent in after hours trading.
This pattern is consistent with what occurred in previous quarters. Even though the market is moving sideways or down, individual stocks are being rewarded for good reporting. This tells us sentiment is still bullish, despite the market’s choppy action over the past few weeks, and points to the bull market resuming once this period of sideways activity ends.
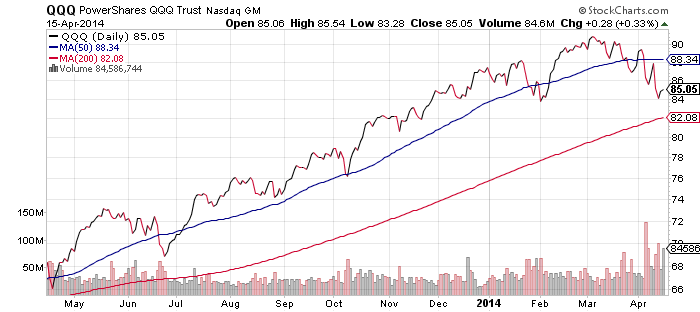
The Nasdaq is one of the most important charts to follow right now. The candlestick chart below shows clearly the Nasdaq bounced right its 200-day moving average on Tuesday, marking a total correction of 9.7 percent from March top to April low. If the market is going to bounce, we should see it in the index. As can be seen in the chart of PowerShares QQQ (QQQ) below, the index also bounced off the February low, which gives us reason to be positive moving forward.

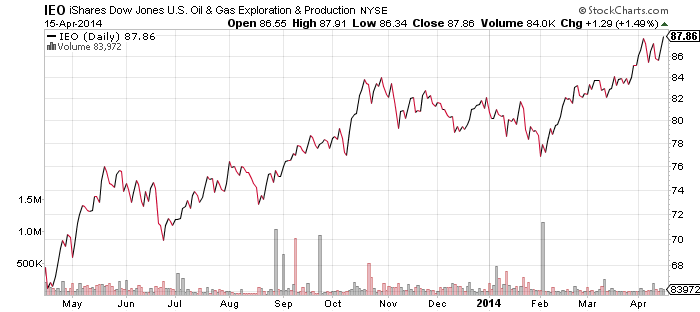
iShares U.S. Oil & Gas Exploration & Production (IEO)
Energy prices moved up over the past week and IEO broke out to a new high. Importantly, Energy Select SPDR (XLE) also broke out to a new high, signaling the energy sector is in a bull market. Amidst the selling of the past few weeks, energy has emerged as a market leader.
First Trust ISE Revere Natural Gas (FCG)
Natural gas has rallied in 2014 and producers are benefiting. As the chart shows, natural gas stocks were in a sideways market from 2010 into 2013, but are showing increased strength. This ETF needs to gain less than 6 percent from Tuesday’s close to advance to a new all-time high.
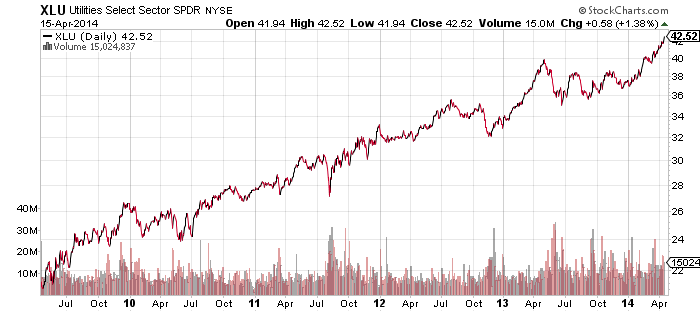
Utilities Select Sector SPDR (XLU)
The utilities sector looks even more bullish than energy. In fact, the chart of XLU gives us pause due to how fast the run-up has occurred. Whereas energy stocks are continuing along a long-term uptrend that goes back years, utilities are accelerating higher, breaking with the slower trend of the past. The outlook for the sector remains bullish, but shares are entering overbought territory. That means a short-term pullback could come in the next few weeks. A potential scenario would be for the broader market to bottom and rally, sending defensive investors out of utilities and back into riskier positions.
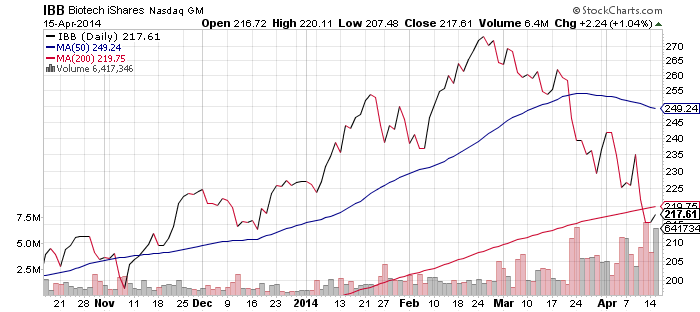
iShares Nasdaq Biotechnology (IBB)
Biotechnology bounced in Tuesday trading. It is now on the underside of its 200-day moving average, which is considered resistant. On the positive side, the bounce on Tuesday was accompanied by heavy volume. That is important because volume tells us where investors and traders are moving. Notice how the drops in price, volume surged (indicated by the red bars at the bottom of the chart). Yesterday’s bounce on high volume is a sign that the selling could be ending. Importantly, the Nasdaq also confirms this interpretation since it also saw heavy volume and a bounce off of major support.
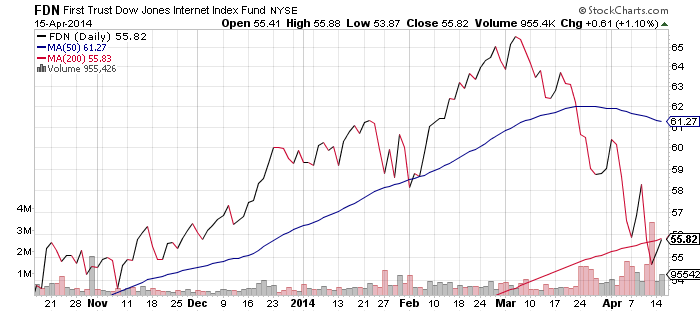
First Trust Dow Jones Internet (FDN)
The bounce in Internet shares was not as positive as the bounce in IBB because it came on low volume. Otherwise, the charts are similar and both funds can rally if the Nasdaq bounces.
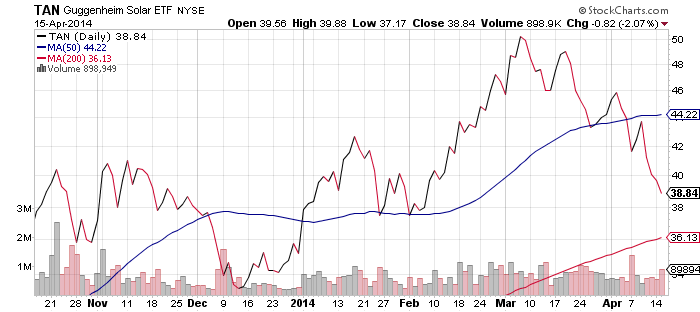
Guggenheim Solar (TAN)
TAN was a disappointment for the bulls this week. It had been a stronger fund from a momentum perspective but this week it played catch-up with biotechnology and Internet shares. TAN was down as much as 5 percent in Tuesday trading before closing with a loss of 2 percent. Previously, it looked as though solar had a shot at bucking the trend and retaining its momentum leadership. The odds of this happening decreased greatly over the past week.
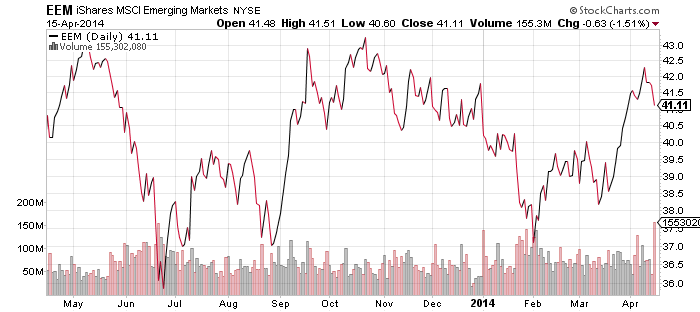
iShares MSCI Emerging Markets (EEM)
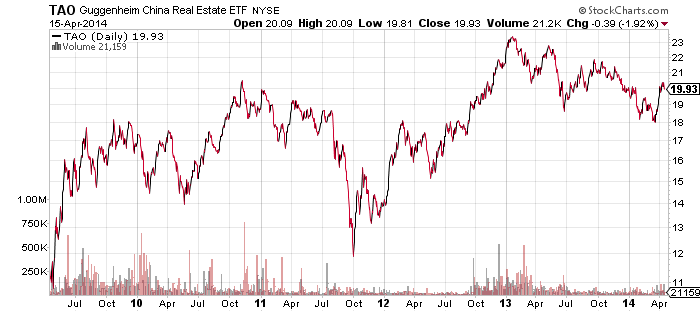
Guggenheim China Real Estate (TAO)
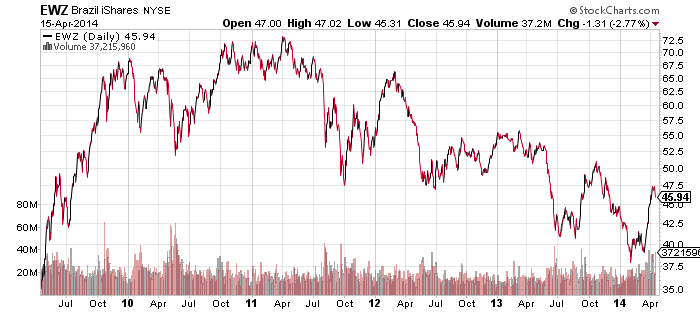
iShares MSCI Brazil (EWZ)
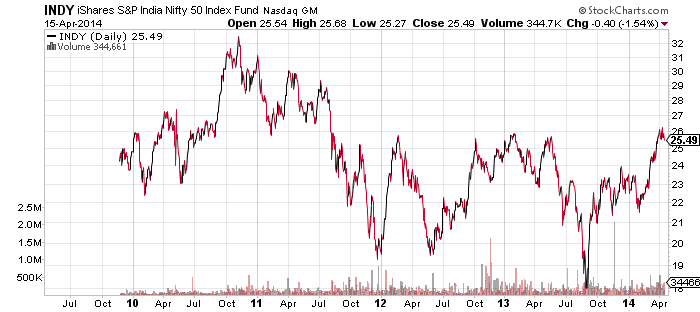
iShares S&P India Nifty 50 (INDY)
Emerging markets bounced over the past month along with energy and utilities. However, unlike the latter two sectors that are breaking out, emerging markets have bounced to major resistance areas and remain below their previous highs. Whereas energy and utilities hit new highs last year, EEM’s all-time high was set prior to the 2008 crisis. That could mean EEM and other emerging market funds with energy exposure are about to play catch-up, but it may also mean they are still stuck in a bear market.
The move in EEM has been driven by bounces in broad Brazil and India ETFs, while broad Russia and China ETFs have moved sideways. The largest holding in iShares MSCI Brazil (EWZ) is Petrobras (PBR), which gained 40 percent in the three weeks between March 17 and April 7. If energy remains strong, EWZ can continue to rise.
As for India, a major parliamentary election began on April 7. Stocks rallied ahead of the election and then stalled once voting began. It is fascinating to watch the Indian electoral system as 800 million voters go to the polls. The election will take place in several stages and require more than a month to complete, ending on May 12. Some background on the election can be found here: Indians vote on key election day. Once investors have a clear understanding of the new government and the policies it can enact, they will start pricing it into stocks.