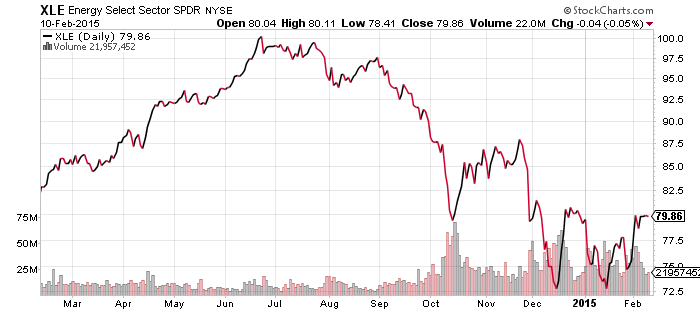
SPDR Energy (XLE)
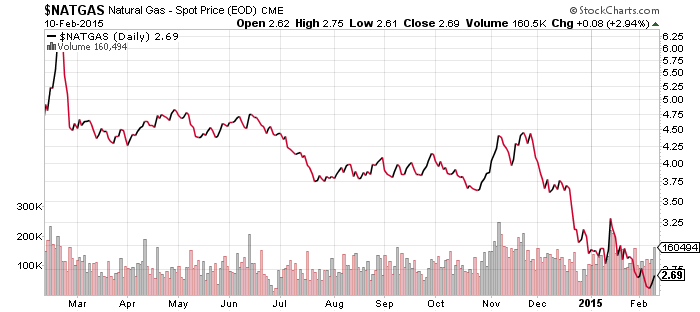
United States Natural Gas (UNG)
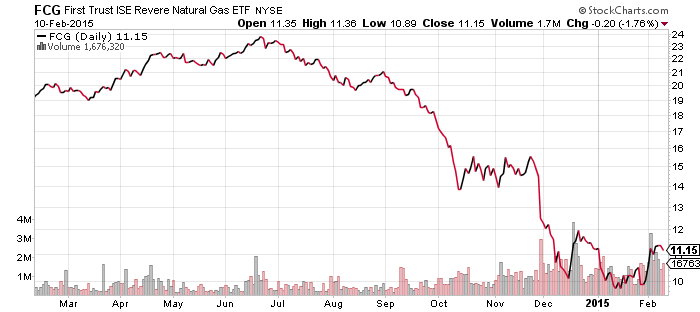
First Trust ISE Revere Natural Gas (FCG)
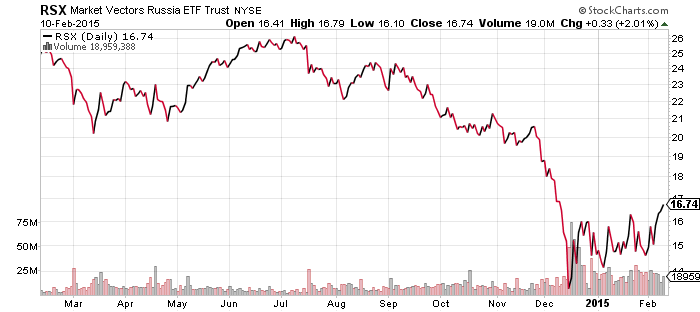
Market Vectors Russia (RSX)
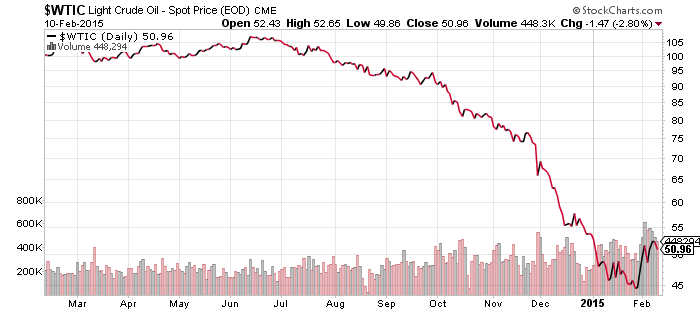
Energy stocks have continued to rebound and it’s a big reason why the broader S&P 500 Index is at a new high in 2015. Energy equities were boosted by rising energy prices, with oil climbing into the $50 range and staying there for several days. A dip into the $40s and a test of the prior lows is still more likely than a V-shaped bounce, and oil was already back below $50 in early trading on Wednesday.
Natural gas has yet to bounce. Much of the country enjoyed warmer than normal weather in the past week, with only the northeast being chilled by arctic air. A cold front is currently rolling across the eastern part of the U.S. Maybe that can budge prices, but they appear to be locked in a steady downtrend. Natural gas is down 40 percent since December. FCG continues to trade in concert with XLE, rather than natural gas prices.
The bounce in energy prices last week helped push RSX out of its trading range. There’s little resistance ahead; $20 to $21 marks the next point of overhead resistance.
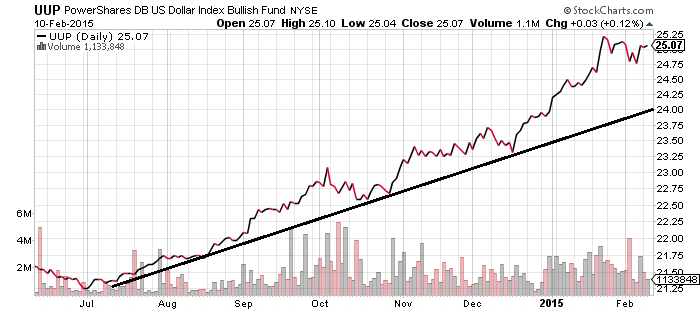
PowerShares U.S. Dollar Index Bullish Fund (UUP)
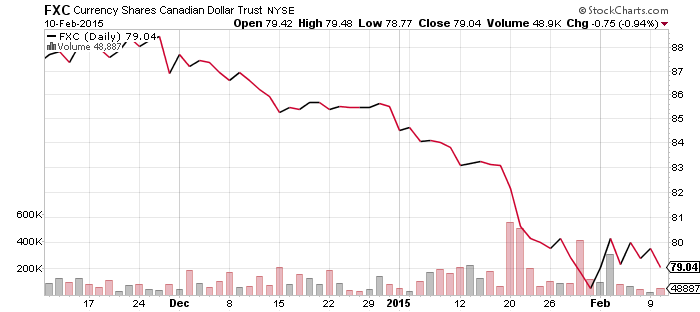
CurrencyShares Canadian Dollar (FXC)
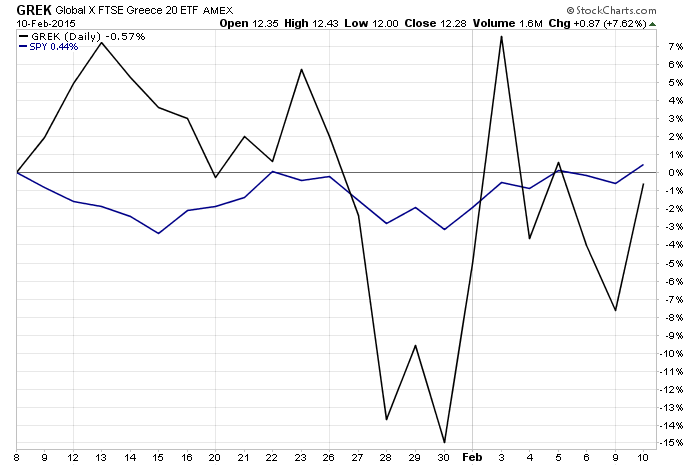
Global X FTSE Greece 20 (GREK)
The U.S. dollar ticked up over the past week thanks to strength against the yen and a small gain against the euro. As the trend line shows, UUP broke out in December as fears of a crisis in Greece mounted. The dollar has since cooled as fears have dissipated, though it remains in a strong bull market.
The Canadian dollar has been relatively weak versus the U.S. dollar, even though oil prices have rebounded. In order for the bullish picture for the U.S. dollar to change, we need to see broad strength versus other currencies. The euro is the main currency for determining the price of UUP, as it tracks the U.S. Dollar Index, of which the euro makes up nearly 60 percent.
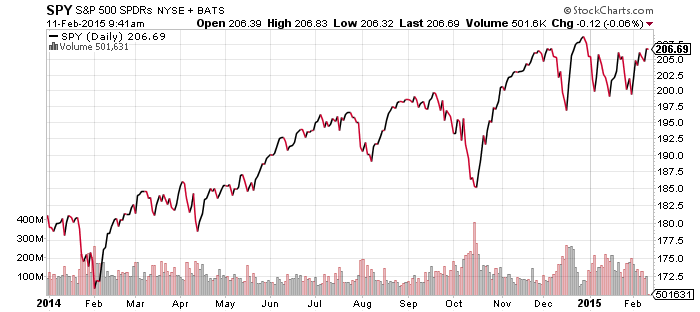
The situation in Greece remains highly volatile. Early this week, reports of a 6-month bailout extension sent Greek stocks rallying, but after denials by European leaders, the move reversed. Greek shares rebounded on Tuesday on renewed hopes of some type of deal. To put the volatility in perspective, the chart of GREK is compared to SPDR S&P 500 (SPY). Based on its price one month ago, SPY has been down as much as 3 percent and up less than 1 percent over the past month. GREK has been down 15 percent and up more than 7 percent, a swing of 22 percent. Today, Greece’s finance minister is in Brussels for talks with European creditors, while the foreign minister is in Moscow to ratchet up Greece’s negotiating position.
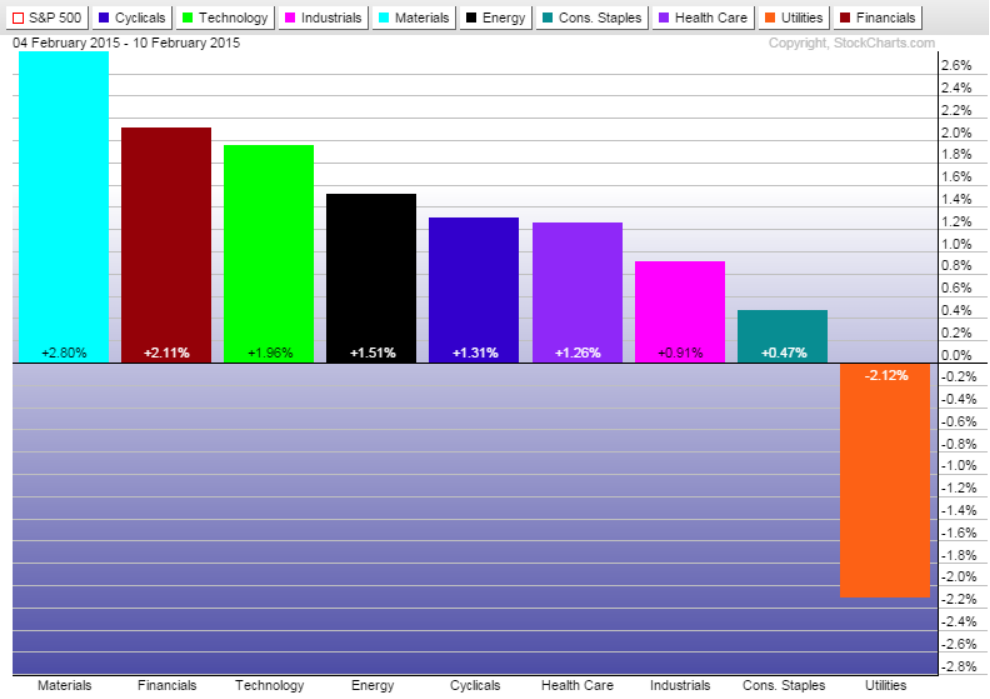
SPDR Utilities (XLU)
SPDR Pharmaceuticals (XPH)
SPDR Healthcare (XLV)
SPDR Technology (XLK)
SPDR Financials (XLF)
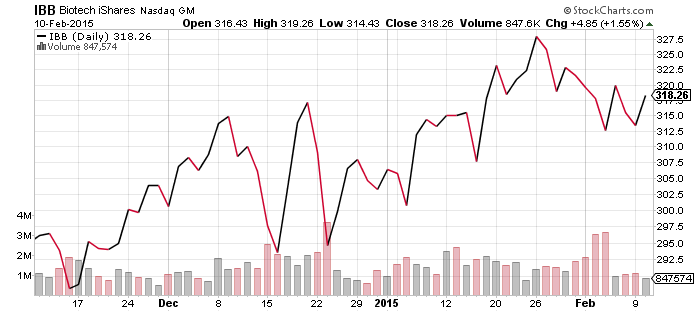
iShares Nasdaq Biotechnology (IBB)
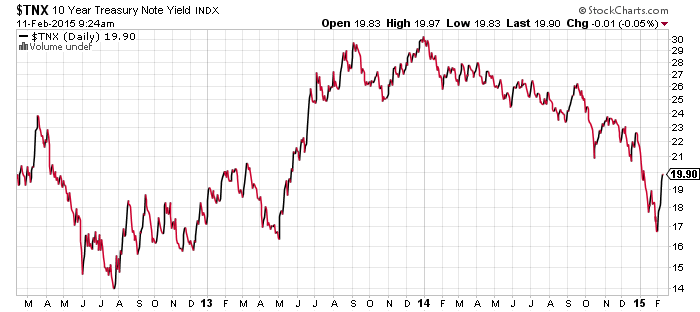
Utilities fell over the past week as interest rates ticked higher and stocks erased their losses for the year. The best performing sectors were some of the worst performing earlier in the year, namely materials, financials, technology and energy. Real estate, which had been leading the market along with utilities, also weakened due to higher rates. The 10-year treasury yield has bounced from below 1.70 percent to nearly 2 percent over the span of two weeks. The longer-term chart of the 10-year yield shows the recent move has retraced a little over half of the drop. The yield needs to climb above 2.2 percent before it could be said to have broken the downtrend started in 2014.
Biotech stocks remain in an uptrend, but they were hit by Gilead’s (GILD) decision to cut the price of its popular hepatitis drug. Pharmaceutical stocks have already pushed on to new 52-week highs and biotechnology should follow as earnings have been strong. Gilead’s price cut decision, for example, overshadowed its strong earnings. The firm beat estimates by nearly 10 percent and earnings were up more than 400 percent year-on-year in the fourth quarter of 2014.
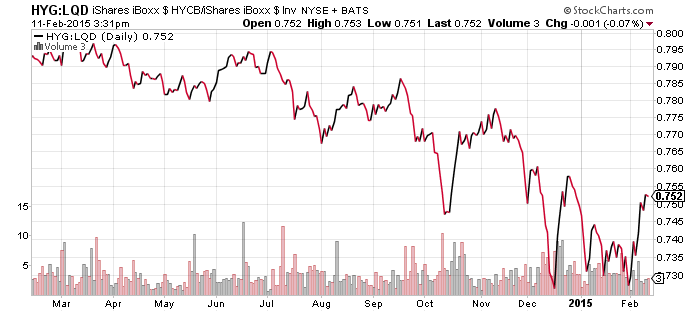
iShares iBoxx $ High Yield Corporate Bond (HYG)
iShares iBoxx $ Investment Grade Corporate Bond (LQD)
An update from last week’s look at the bond market: investors continued moving back into high-yield as risk appetites increased during the week.
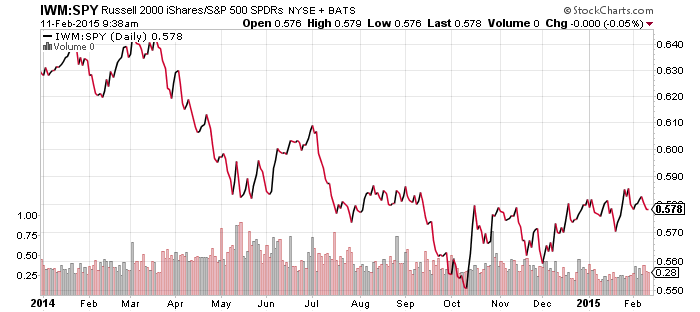
SPDR S&P 500 (SPY)
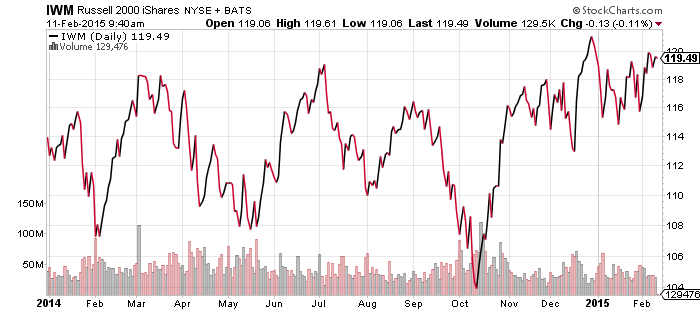
iShares Russell 2000 (IWM)
Small-caps have been performing well since October and are now back to the relative price level they were at in late summer. This level has proven to be a resistance point and the price chart of IWM alone shows that small-caps have been struggling to break away from the trading range they were trapped in last year. The strength in small-caps relative to large caps in 2015 is bullish and it would not take a large push for the broader market to hit new all-time highs, with small-caps likely becoming a market leader. Nevertheless, while U.S. economic and earnings data is strong, a bullish breakout may require a positive resolution concerning Greece’s situation.