PowerShares DB U.S. Dollar Index Bullish Fund (UUP)
The U.S. Dollar Index made its 12th consecutive weekly gain for the week ending October 3, but then pulled back over the following days. The greenback is unlikely to resume its upward path until it takes a healthy breather, which could mean a decline or a sideways move.
Longer-term, there is a very interesting repeating pattern in the U.S. Dollar Index. From 1985 to 1997, there is a roughly 6 year decline into 1991 and then a bottoming process with a triple bottom, and a major rally in 1997. That rally was three months long (stretching back into December 1996) and an almost uninterrupted rise in the dollar. Four months later, the Asian Crisis began.
From 2002 to 2008, there is a six year decline and then a bottoming process with almost the same triple bottom formation. This year there has been a historic rally in the U.S. dollar, three months long and uninterrupted on a weekly basis, though slightly smaller in percentage terms than the 1997 move.
The similarities are uncanny and the possibility that this continues are greater than a sudden change in the opposite direction. There are several avenues for a crisis overseas. The yen is very weak, the eurozone is still in recession and Greece is again in trouble of defaulting in 2015. Moreover, China and other emerging markets have increased their debt levels rapidly over the past six years. China is also seeing its currency appreciate with the dollar, which is hurting the earnings of Chinese exporters. Were the euro, yen or emerging market currencies to sell off even further, the Chinese might be forced to let the yuan slide as well.
Following the timeline from 1997, a crisis could arrive around February of next year. This would again make the U.S. dollar , U.S. Treasuries and U.S. assets in general a safe haven.
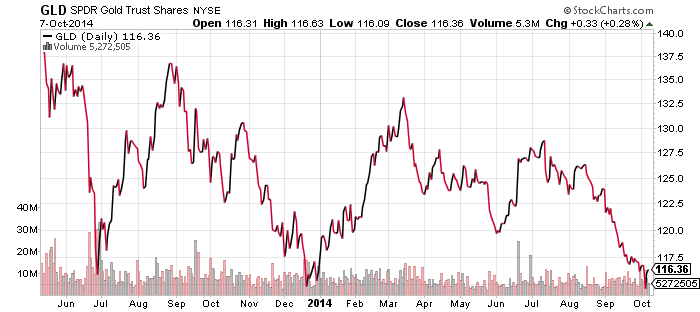
SPDR Gold Shares (GLD)
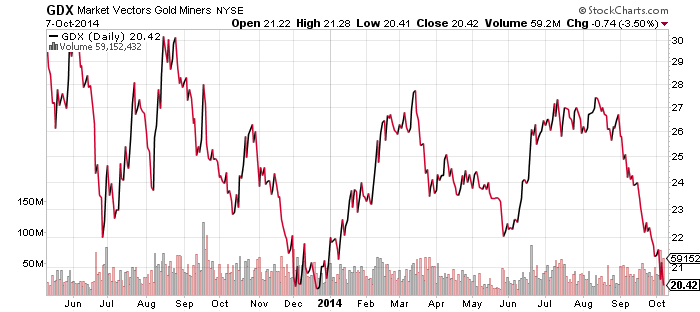
Market Vectors Gold Miners (GDX)
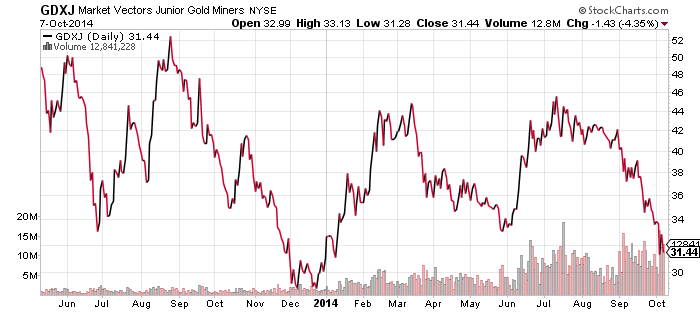
Market Vectors Junior Gold Miners (GDXJ)
It is do or die time for gold and the mining shares. Both miners and the metal itself have hit support and this is either a great buying opportunity or the prelude to a major breakdown. Most likely a drop in gold would not be a solo event, as oil and other commodities are also under tremendous pressure. Junior mining shares are more volatile than the larger miners found in GDX. However, it may be that gold bulls are hanging on strong and refusing to sell their junior mining shares, since they are extremely undervalued if gold does not experience another plunge.
If gold does break from current levels and sets a new low, it will invite major selling by technical and short-term traders looking to scare the remaining bulls out of the market. Gold could quickly move down to the $1100 level.
Longer-term, given what the U.S. dollar chart is showing, gold’s real test will come if there indeed is a parallel crisis to 1997 in 2015. Due to the small size of the gold market relative to bond and stock markets, it would only take a small portion of investors deciding to buy gold instead of dollars to allow gold to outperform. On the flip side, the number of investors holding gold to hedge against a collapse in foreign currencies is smaller than those expecting the U.S. dollar to drop. If those investors are flushed out of the market as they were from 1997 through 1999, the lower price targets of $1000 and below are not out of the realm of possibility.
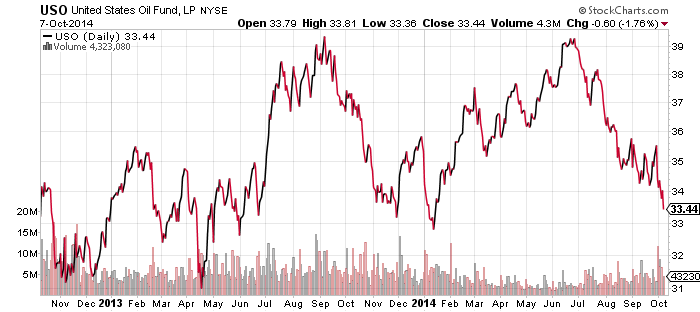
United States Oil (USO)
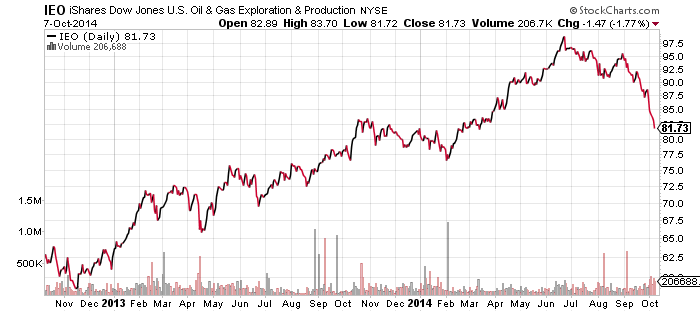
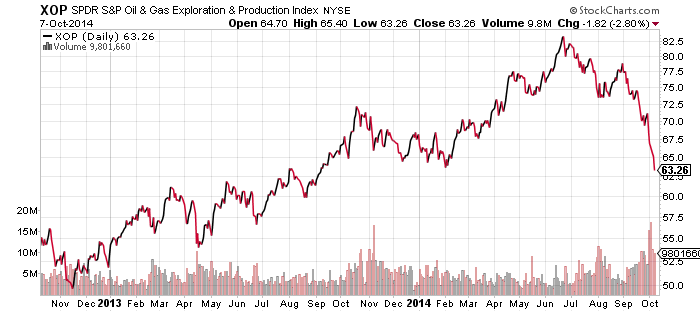
Oil prices are at a new low for the year. Even though USO has held up a bit better, both USO and crude oil itself are approaching important support levels, as are energy subsector funds such as iShares U.S. Oil & Gas Exploration & Production (IEO). The SPDR fund covering this sector, XOP, has already broken down to new lows for the year and is now negative on the year.
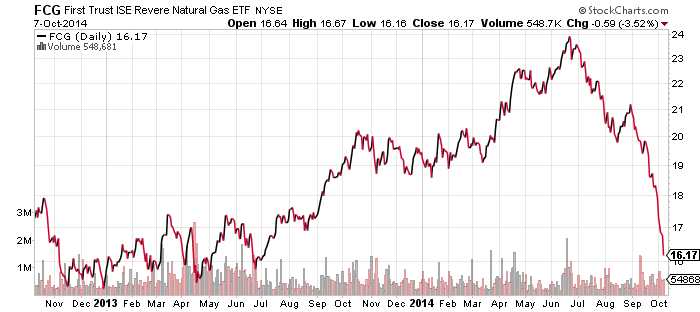
Even though natural gas prices have continued to remain flat, natural gas stocks continue to head lower with the rest of the energy complex and First Trust ISE Revere Natural Gas (FCG) is also nearing a major support level.
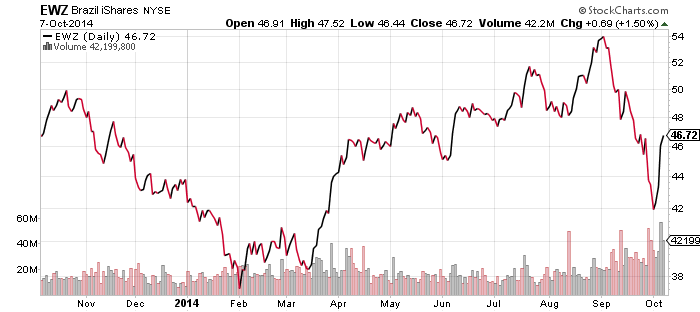
iShares MSCI Brazil (EWZ)
Shares of the Brazil ETF enjoyed a 10 percent rally over the past few days, following its prior loss of nearly 20 percent. President Rousseff failed to win a majority in the presidential election, setting up a run-off with pro-business candidate Aecio Neves. Neves was actually running third in the race, but after a barrage of attack ads knocked the other challenger down, the result was Neves pulling into second place while Rousseff was unable to win a majority of votes. The third place candidate, Silva, is now considering giving her support to Neves.
The largest holding in EWZ is Petrobras (PBR), so even if the political situation goes in Brazil’s favor, the oil sector also needs to bounce for EWZ to recover.