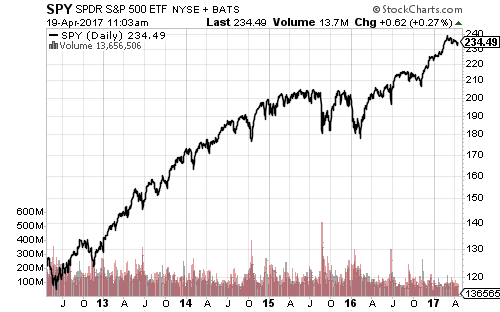
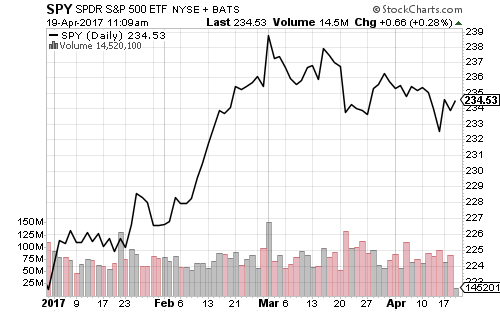
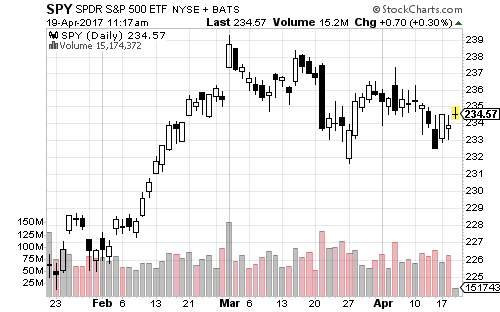
SPDR S&P 500 (SPY) is up 13.5 percent from its November 2016 low, despite the recent consolidation period. SPY is still on pace to gain more than 30 percent in 12 months.
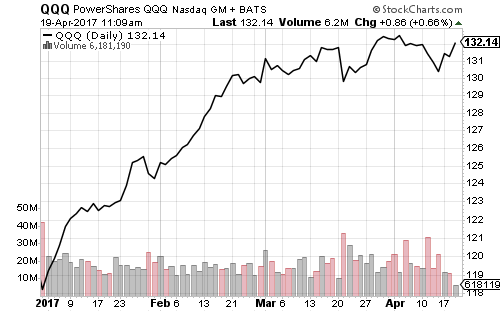
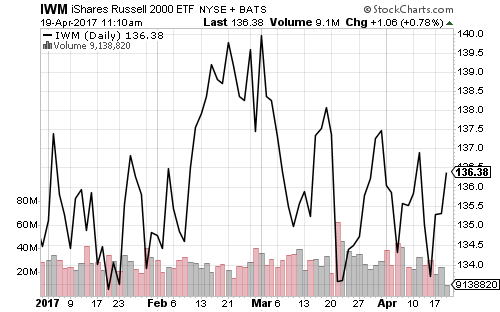
The Nasdaq continues to outperform the broader market. A 0.3 percent rally will lift PowerShares QQQ (QQQ) to a new all-time high. The Russell 2000 is also looking stronger. iShares Russell 2000 ETF (IWM) has refused the break below $133 since December. The Dow Jones Industrial Average and SPY made new closing lows in April, but both are trading above their March lows.
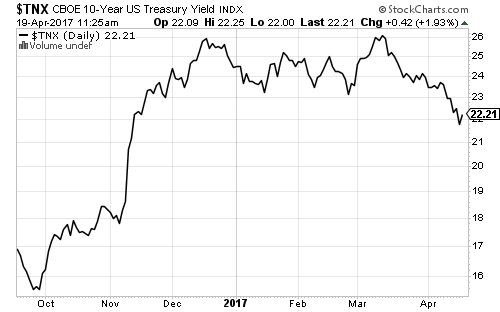
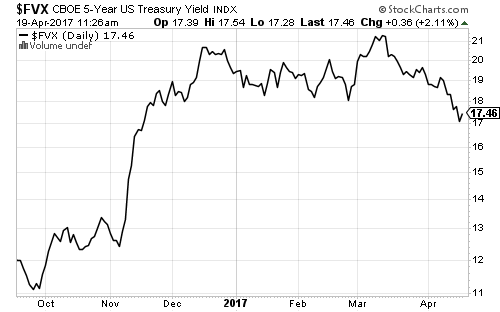
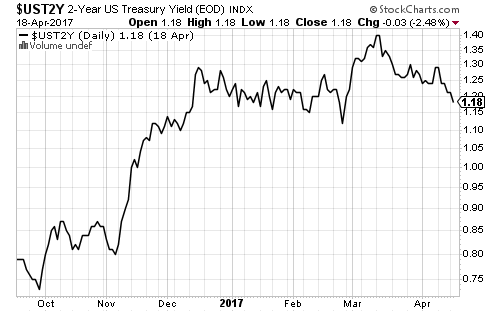
Intermediate- and long-term Treasury yields broke below their trading ranges to the lowest level since November 2016. This is bullish for all longer maturity government, investment-grade and corporate bonds.
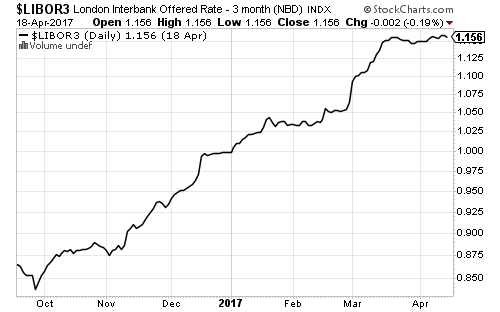
The 2-year Treasury yield is also worth watching this week. A break below 1.10 percent yield would signal a broader rally in bonds. There has been no weakness in Libor, the key interest rate for floating-rate funds.
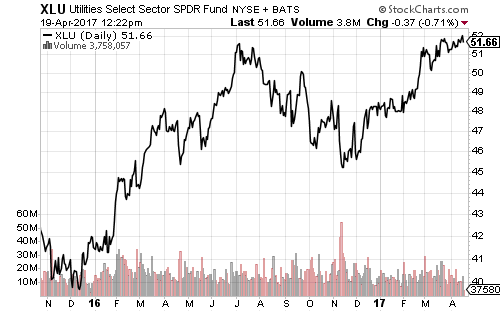
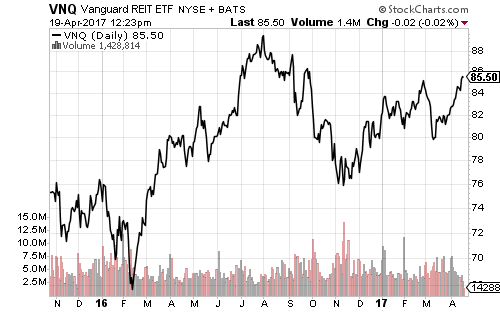
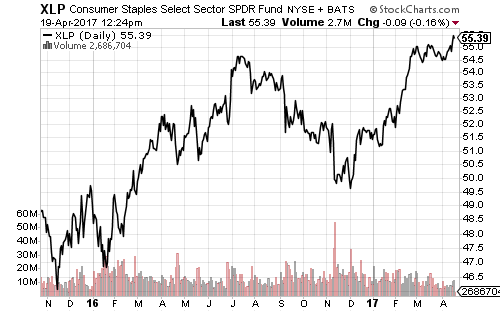
Rate-sensitive utilities and real estate are benefiting from falling interest rates. SPDR Utilities (XLU) set a new all-time high last week. Vanguard REIT (VNQ) has shown a similar pattern over the past year, but remains below its 52-week high. SPDR Consumer Staples (XLP) is less sensitive to interest rates, but spiked to a new all-time high this past week.
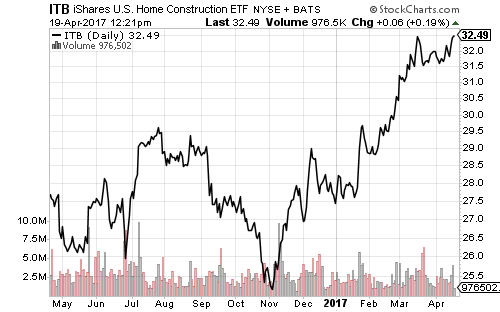
Tuesday’s housing market data was mixed. March housing starts were below the median forecast at 1.215 million, but building permits climbed to 1.260 million. iShares U.S. Home Construction (ITB) shares are on the verge of setting a new post-housing-bubble high.
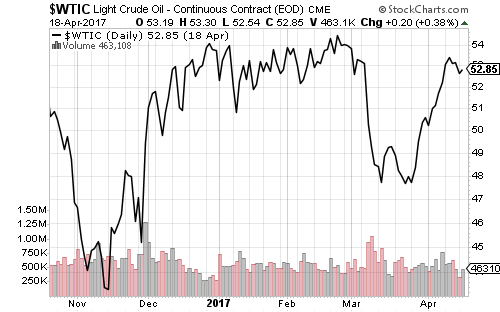
Crude oil pushed back to $53 a barrel and has held that level for more than a week. Inventory fell over the past week, but gasoline inventory rose.
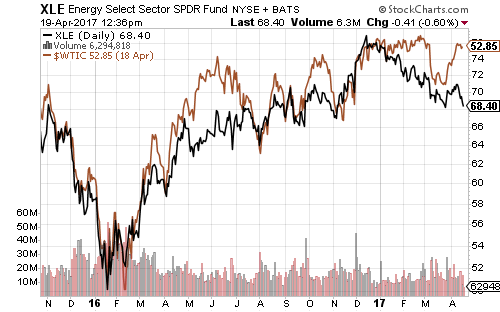
XLE fell over the past week and is now approaching its 2017 closing low of $68.24. The dip threatens the series of lower highs for XLE going back to the January 2016 bottom.
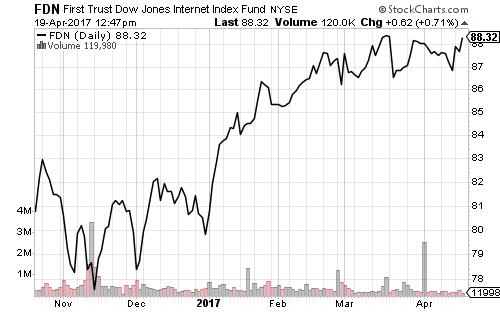
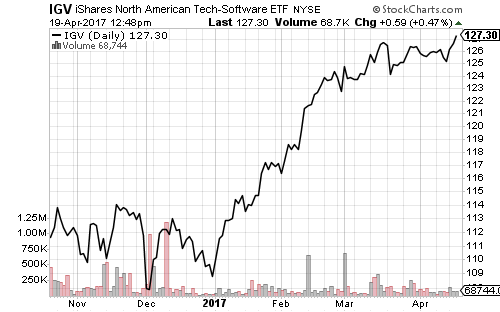
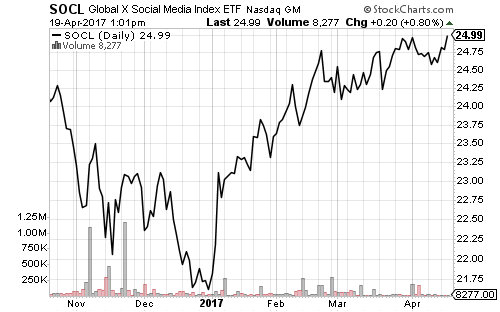
Internet and software are the two strongest technology subsectors. The software sector, as tracked by iShares North American Software (IGV), is making new all-time highs daily. Social media shares have also rebounded strongly from their 2016 drop.
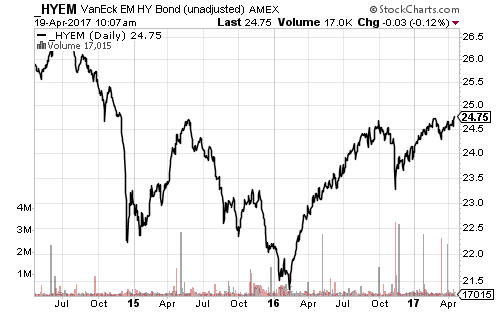
Emerging markets are off to a good start in 2017. VanEck Emerging Market High Yield Bond (HYEM), with dividends stripped out, is reflected in the chart below. The chart shows an inverted head-and-shoulders pattern that completed this past week. The upside target for HYEM is around $28 per share, a gain of more than 10 percent.
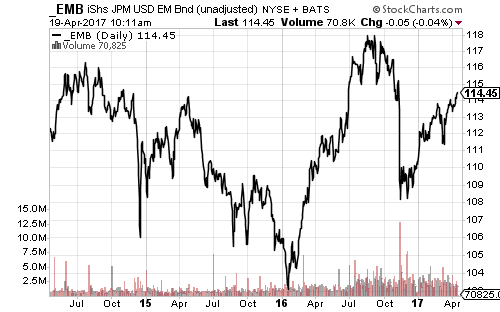
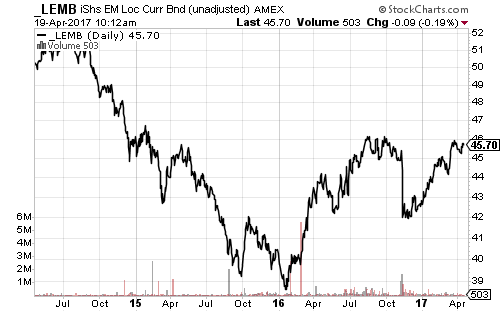
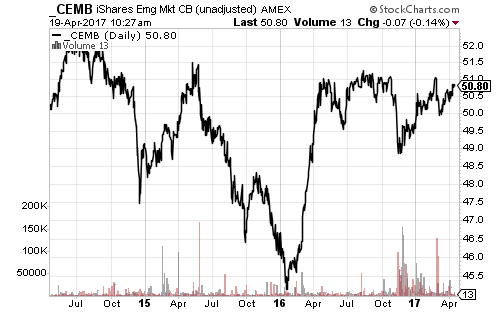
iShares Emerging Market Local Currency Bond (LEMB) is on the cusp of breaking out from a 2-year consolidation pattern. iShares Emerging Market Corporate Bond (CEMB) also has an inverse head-and-shoulders pattern. JPMorgan USD Emerging Market Bond (EMB) does not show the same pattern as it holds debt denominated in U.S. dollars.
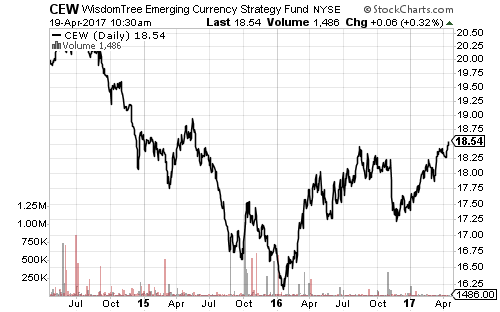
WisdomTree Emerging Market Currency Strategy (CEW) is approaching 2-year highs.
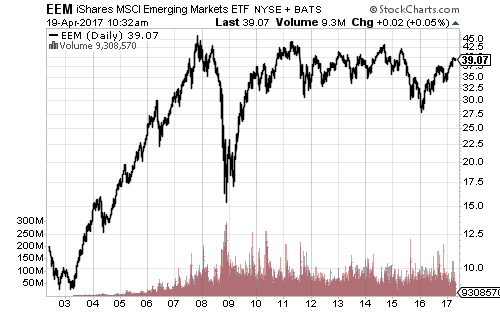
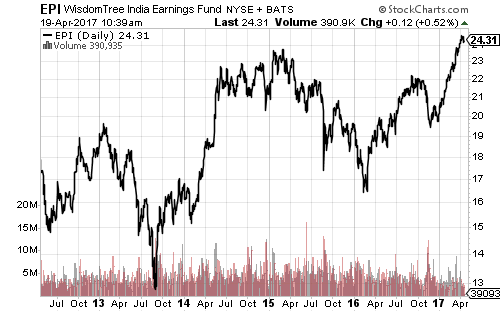
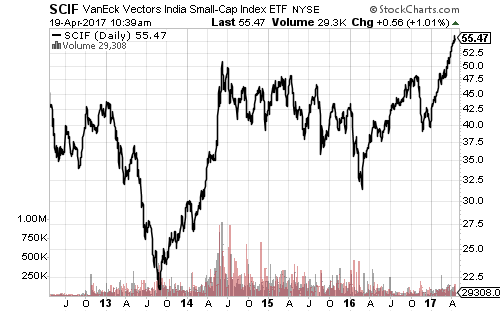
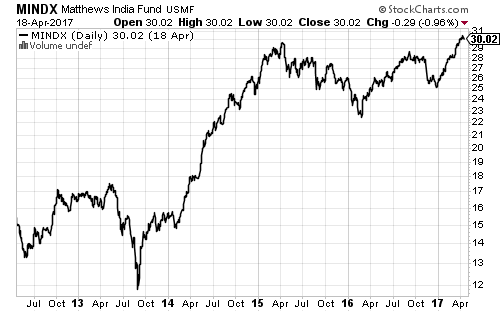
iShares MSCI Emerging Markets (EEM) peaked almost a decade ago, and has since traded in the $30s. Weakness in commodities and oil hammered Brazil and Russia, while China’s markets rapidly fell more than 3 percent. India, however, has lifted this sector of the market. India ETFs and mutual funds are trading at 5-year highs.
EEM needs to rally more than 15 percent to set a new all-time high.

